sentometrics research repository
An open-source repository about sentiment+econometrics research.
View the Project on GitHub sborms/econometrics-meets-sentiment
| Papers | Links | Workflow | Glossary |
Workflow
A complete sentometrics workflow extends a typical applied econometrics process with additional steps inherent to the use of qualitative data that need to be transformed into numbers. The workflow serves to discover or confirm a certain theory or hypothesis, and therefore starts with a question. A clear question is important, because the required tools to solve it can be very different. For instance, in macroeconomics and politics one is particularly interested in aggregate categorizations, whereas in computer science, the interest lies more in the correct classification of individual data units. A generic example of a question is what and how large the effect of a set of particular sentiment variables is on a continuous variable of interest.
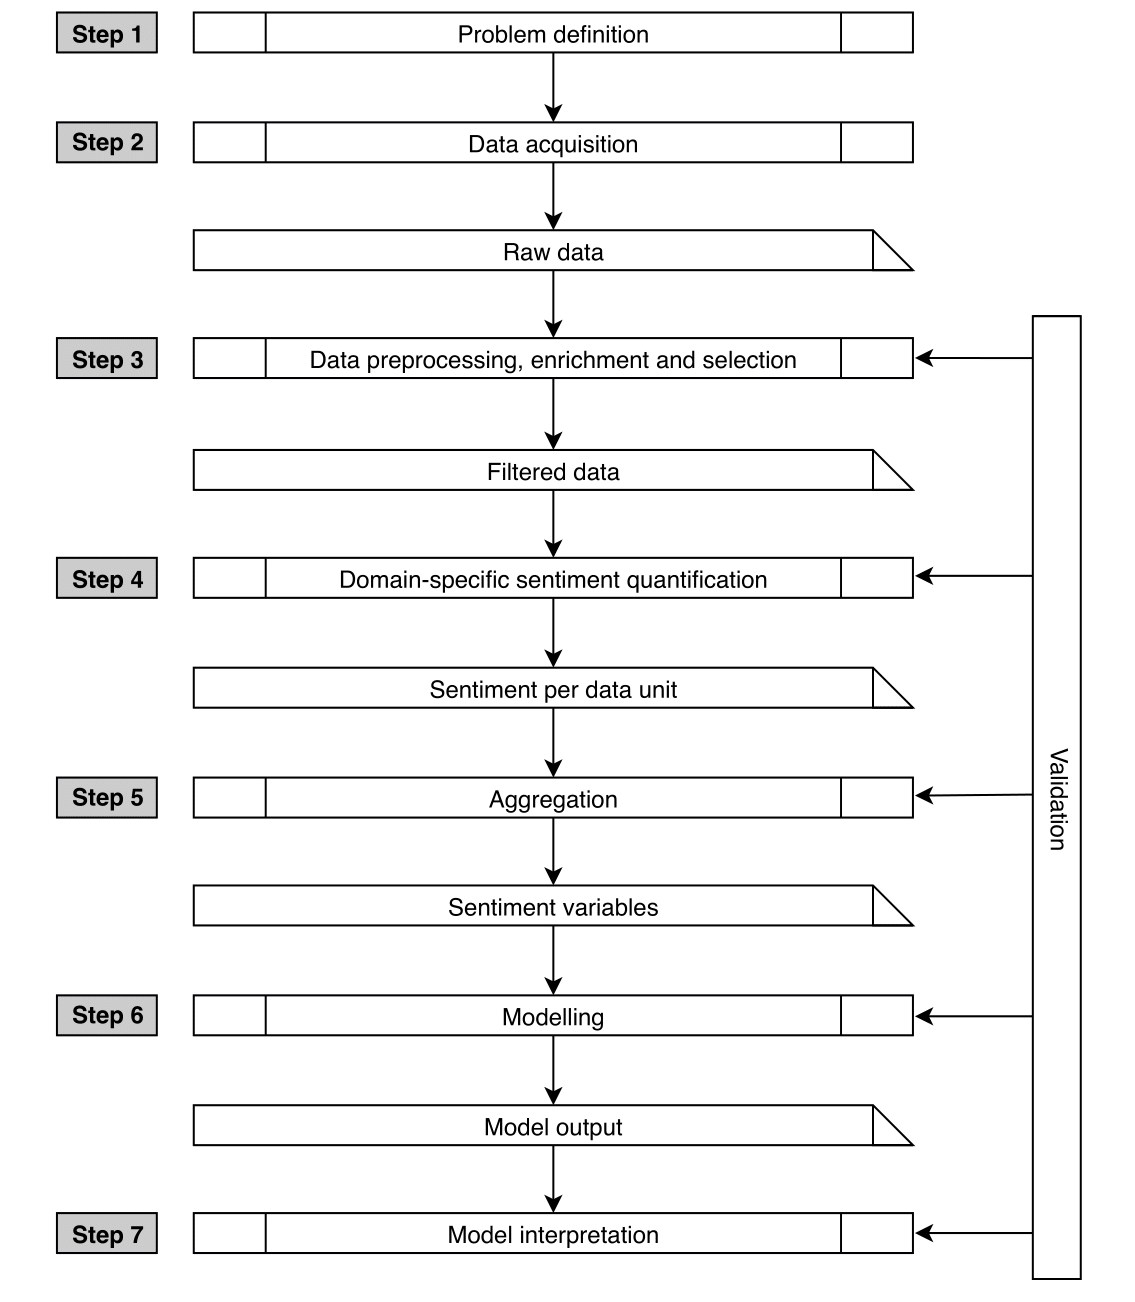
The initial step towards answering the question is the acquisition of the data to construct the sentiment variables from. Qualitative sentiment data consists of expressions in the form of verbal or nonverbal communication, naturally leading to three datatypes, namely textual, audio, and visual data. Examples are news media articles, conference calls, and images. Each data point may already contain a rich metadata component including elements such as the date and the source.
Next is the preprocessing, enrichment, and selection of the relevant sentiment data. All three datatypes are in unstructured form, requiring to undertake some preprocessing to clean the data and impose a consistent structure. For the data retrieved, ideally much relevant metadata are generated, which we refer to as features. A feature is a broad term that can be anything attached to the original data, from source, expressor, entity, location, topic, and so on. The necessity of including features in the analysis depends on the problem. Selection of the qualitative data is application-specific. One should always be able to verify why a specific sample is representative for the sentiment variables that one is trying to model.
Once a structured and confined data set is obtained it can be used to assess the individual sentiment, at the desired level of data unit granularity (e.g. a sentence, a full article, a sequence of sounds, a video, or an image). This leads to a quantitative sentiment data set. The process of creating valuable and structured data from unstructured data appeals to the popular process of “datafication.”
For the problems that require a cross-sectional approach, properly aggregated individual sentiment scores per data unit are sufficient. However, for many other analyses, especially in economics and finance, a time series perspective is necessary. For this, some type of aggregation into time series is needed to construct meaningful sentiment variables. First, the low-level sentiment scores per data unit are spread out across the metadata features. Second, these different feature-sentiment scores are cross-sectionally aggregated for a given time unit (e.g. daily) to obtain time-varying sentiment measures. Third, these measures can be further aggregated across time using different time series weighting functions, to result in the final sentiment variables. We consider a sentiment variable to be a time series of sentiment extracted from given data, with particular sentiment calculation, feature, and aggregation characteristics.
Once the aggregated sentiment variables are obtained they can be used in an econometric analysis. A final aggregation of interest is across sentiment variables, which can be done as an additional premodeling aggregation step, or seen as the output of the modeling step. Given the problem defined in the first step, a model which describes the joint distribution of the dependent and the independent (sentiment) variables of interest is proposed. In the model interpretation step, the outcome of the model is qualitatively and statistically interpreted to explain the results and find an answer to the original question.
Every step has to be subject to a validation analysis. One has to reiterate back to improve separate steps in the workflow depending on where a problem occurs. Problems across the workflow can arise as late as during the final validation step. For example, the model representation related to the question may have to be reformulated, or the variable construction improved to obtain more substantial sentiment proxies. Validation is particularly important in an econometric analysis with sentiment extracted from textual, audio, or video sources, because it suffers from a “joint hypothesis” problem. A model not capturing a relationship between sentiment and other variables can be due to either a bad proxy of sentiment, or due to truly no existing connection. Validation in each step of the process using several methods is crucial to counterbalance this problem. An econometric model is validated in terms of statistical and economic significance, out-of-sample forecast precision, visual fit, attribution, parameter stability, validity of the assumptions, and a comparison to baseline models.